Pie Chart

Example
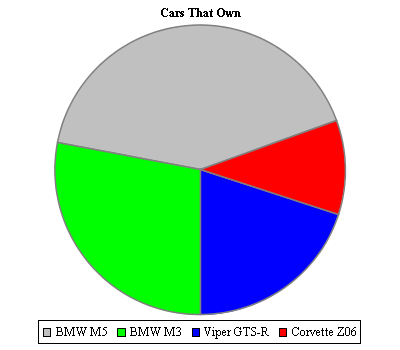
Here is a simple Pie Chart.
double[] data= { 81d, 55d, 39d, 20.6d };
String[] labels= { "BMW M5", "BMW M3", "Viper GTS-R", "Corvette Z06" };
Paint[] paints= { Color.lightGray, Color.green, Color.blue, Color.red };

PieChart2DProperties pieChart2DProperties= new PieChart2DProperties();
PieChartDataSet pieChartDataSet= new PieChartDataSet( "Cars That Own", data, labels, paints, pieChart2DProperties );

PieChart2D pieChart2D= new PieChart2D( pieChartDataSet, new LegendProperties(), new ChartProperties(), 320, 320 );
Zero Degree Offset
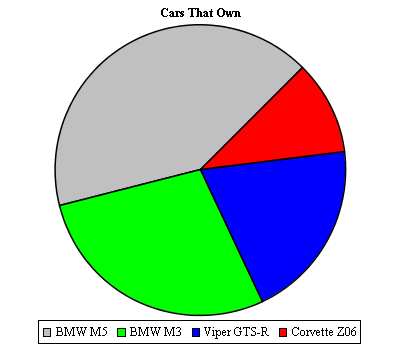
If we would like to have the 'first' slice of the pie start at somewhere besides zero degrees, we could add the following code to make it start at 45 degrees. Note where the blue slice starts.
pieChart2DProperties.setZeroDegreeOffset( 45f );


Border Stroke
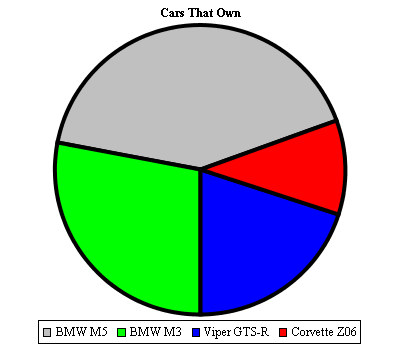
The border of the Pie Chart uses the java.awt.Stroke Interface to control its rendering properties. There are several implementations of the java.awt.Stroke Interface in the java.awt Package to choose from.
pieChart2DProperties.setBorderStroke( new BasicStroke( 4f ) );


Border Paint
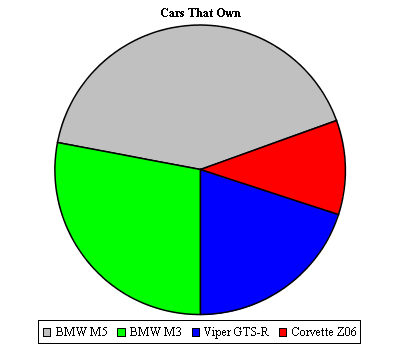
The border of the Pie Chart uses the java.awt.Paint interface to control its rendering properties. There are several implementations of the java.awt.Paint Interface in the java.awt Package to choose from.
pieChart2DProperties.setBorderPaint( Color.gray );