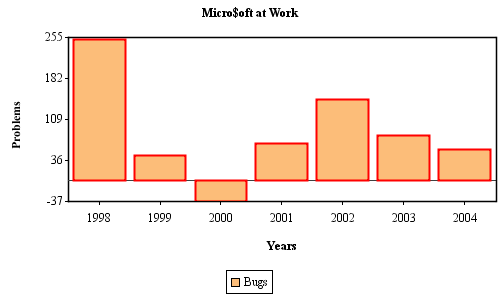
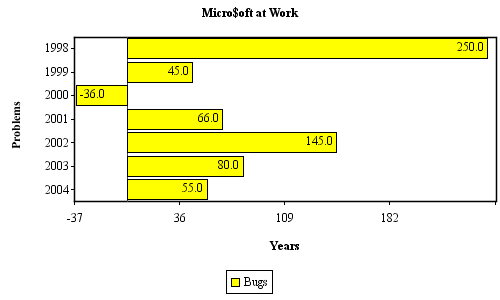
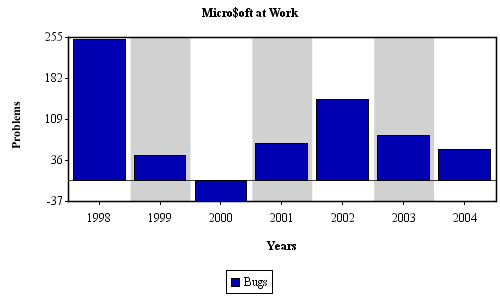
String xAxisTitle= "Years";
String yAxisTitle= "Problems";
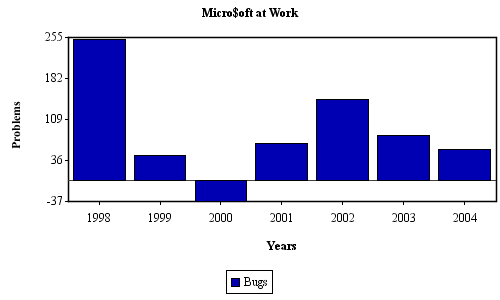
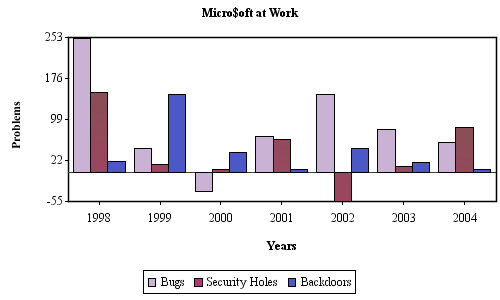
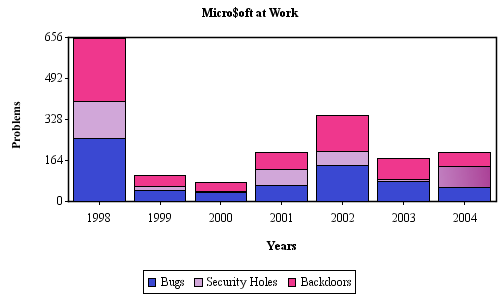
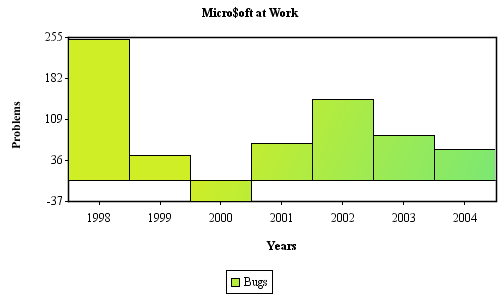
String title= "Micro$oft at Work";
DataSeries dataSeries = new DataSeries( xAxisLabels, xAxisTitle, yAxisTitle, title );
double[][] data= new double[][]{ { 250, 45, -36, 66, 145, 80, 55 } };
String[] legendLabels= { "Bugs" };
Paint[] paints= new Paint[]{ Color.blue.darker() };
BarChartProperties barChartProperties= new BarChartProperties();
AxisChartDataSet axisChartDataSet= new AxisChartDataSet( data, legendLabels, paints, ChartType.BAR, barChartProperties );
dataSeries.addIAxisPlotDataSet( axisChartDataSet );
ChartProperties chartProperties= new ChartProperties();
//---to make this plot horizontally, pass true to the AxisProperties Constructor
//AxisProperties axisProperties= new AxisProperties( true );
AxisProperties axisProperties= new AxisProperties();
LegendProperties legendProperties= new LegendProperties();
AxisChart axisChart= new AxisChart( dataSeries, chartProperties, axisProperties, legendProperties, AxisCharts.width, AxisCharts.height );