All Bar Charts |  |
All Bar Charts | ||
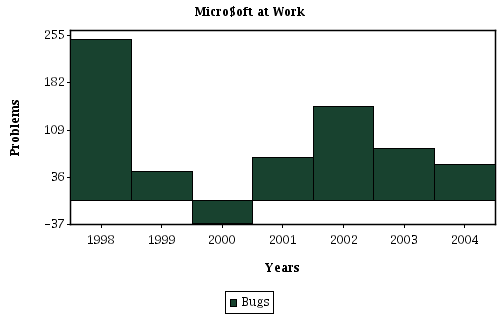
This section shows common settings available to all Bar Charts. A Simple Bar Chart is used only for illustrative purposes.
Bar Width | ||
jCharts allows you to specify the width of the bars in the chart relative to the amount of space allocated to each scale item. This is specifed by a percentage value, 1=100%, .5=50%, etc...
barChartProperties.setWidthPercentage( 1f );
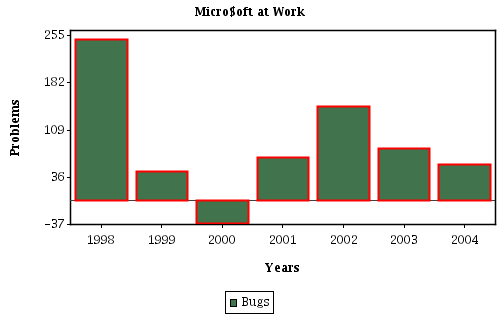
Bar Outline | ||
jCharts allows you to specify the 'outline' properties of the bars. The default values are to show a one pixel wide, black outline. This is set on the BarChartProperties Object, from which all Bar Chart Types extend.
barChartProperties.setShowOutlinesFlag( true );
ChartStroke outlineChartStroke= new ChartStroke( new BasicStroke( 2.0f ), Color.red );
barChartProperties.setBarOutlineStroke( outlineChartStroke );
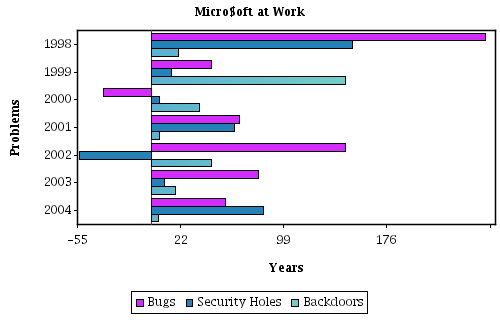
Horizontal Plots | ||
Each of the Bar Chart Types can be plotted Horizontally by simply passing a flag to the AxisProperties Constructor.
AxisProperties axisProperties= new AxisProperties( true );
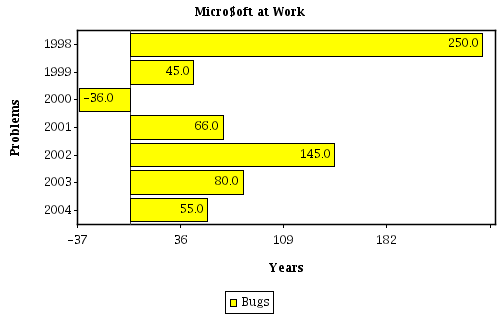
Bar Labels | ||
It is possible to display value labels on your Bar and Clustered Bar charts, but not Stacked Bar Charts. To do this, add a ValueLabelRenderer to the BarChartProperties Object by calling the addPostRenderEventListener( PostAxisValueRenderListener ) method.
You can set the Font and Paint used for the Values on the ValueLabelRenderer Object.
ValueLabelRenderer valueLabelRenderer = new ValueLabelRenderer( false, false, true, -1 );
valueLabelRenderer.setValueLabelPosition( ValueLabelPosition.AT_TOP );
valueLabelRenderer.useVerticalLabels( false );
barChartProperties.addPostRenderEventListener( valueLabelRenderer );